

How One Google Team Built Storytelling Into Analytics
How can you drive more value from analytics? Consider the framework an analytics leader used to build narrative into the stack — and turn it into strategic speed
Topics
News
- India-US Talks Put AI Stack In Focus
- OpenAI Plans Limited GPT-5.6 Rollout After White House Request
- Employers Still Want MBAs Even as One in Three Hands Entry-Level Work to AI
- AI Dispatch | Infosys Pitches AI Growth
- India May Take Minority Stake In Sarvam AI
- India Eases Satcom Rules by Dropping Sourcing Clause

Even the most advanced analytics models can fall flat if they don’t use the language of the organization’s decision makers. And when the related decision-making process stalls, it’s often because the data insights lack a clear narrative, business context, or connection to what executives care about. Those are lessons we learned at Google’s Small and Medium Business (SMB) division when my analytics team built a sophisticated model to optimize staffing for the company’s global support organization.
The model was able to forecast volatile demand across more than 100 countries by simulating thousands of possible scenarios and could recommend sales and customer support staffing levels. It accounted for seasonality, geographic differences, and even complex customer prioritization rules. We validated the data, vetted assumptions, and pressure-tested the logic.
But when we presented the model to senior stakeholders, they showed little enthusiasm. Instead of appreciating the model’s complexity, the stakeholders focused the discussion on the practicality of our recommendation model. One leader asked, “What does this mean for next quarter’s staffing in Latin America?” Another questioned how the recommendations would move the needle for her bottom line. Weeks of work stalled. No business decision was made.
This wasn’t an isolated incident. Repeatedly, technically sound models had failed to generate movement at the executive level. While many of our data professionals believed that better models would lead to improved business outcomes, executives were overwhelmed by the complexity and skeptical of black-box insights they could not contextualize.
The lesson was clear: Analytics must be built for how decisions are made, not just how data is analyzed. This required that we rethink the analytics stack — not just the data and models but also how storytelling can guide every stage of the process.
So in 2023, we began building an original framework with narrative at its core, with the goal of enabling business leaders to make faster and more confident decisions. The framework drew on lessons from a series of internal projects. Once I had conceptualized and structured the model, it was refined and pressure-tested through mid-2024 with my analytics team and business stakeholders. Since then, as head of analytics for Google’s SMB division, I’ve implemented this approach directly in high-impact projects involving sales strategy optimization, business planning, and executive decision enablement.
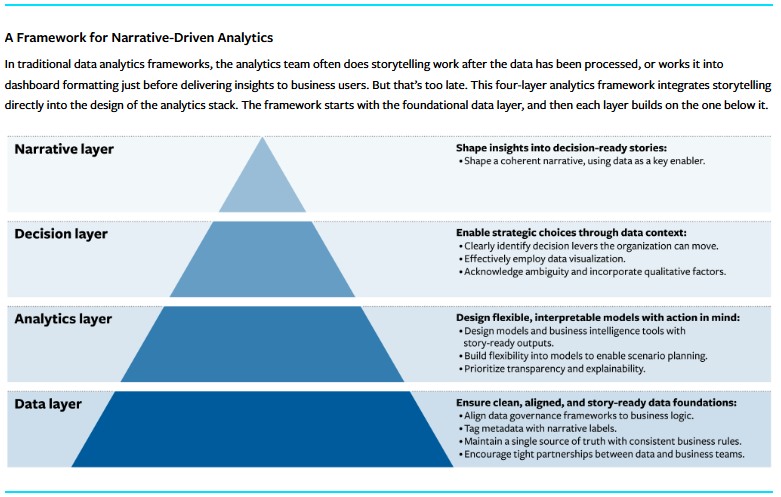
- Data layer: Builds business-aligned data foundations.
- Analytics layer: Designs flexible, interpretable models that anticipate and address executive needs.
- Decision layer: Structures outputs around actionable levers, trade-offs, and constraints.
- Narrative layer: Delivers coherent, contextualized insights that lead to action.
Each layer builds on the one below it to form a structured approach that helps executives make better, faster decisions.
Data Layer: Start With Shared Definitions
Consistent data is a critical storytelling enabler and the first step toward action.
One project involved analyzing sales engagement to determine the ideal number of customer meetings that a sales rep could sustainably manage. This insight played a key role in informing sales coverage models and capacity planning. We discovered that teams had varying definitions of what did and didn’t qualify as a customer meeting. Sales teams defined it as everything from a brief email exchange to an all-day conference, while the business strategy team counted only scheduled phone calls or in-person conversations. We found instances where teams reported having had more than twice the number of meetings as other teams within the same region because they used different definitions. This discrepancy resulted in wildly different customer-to-representative ratio recommendations.
We quickly realized that without a common, business-relevant definition for “customer meeting,” our insights were not credible enough to support actual decision-making.
To address this, we aligned our data governance logic with business context. Partnering with cross-functional teams, we defined “customer meeting” based on the specific decision at hand. We agreed to prioritize building substantial, enduring customer partnerships. Only scheduled phone or in-person conversations qualified; emails and similar interactions were recategorized as light-touch engagement. We also built a unified data source that categorized meetings by channel and tagged each one by engagement depth.
These efforts gave business leaders confidence in the data and clarity on what it represented. Reviews required fewer clarifying questions, which allowed teams to move faster during go-to-market planning. As this example demonstrates, consistent data is a critical storytelling enabler and the first step toward action.
Analytics Layer: Build Models That Executives Understand
Analytical sophistication and accuracy are valuable, but business executives prioritize model explainability and practical relevance. Black-box models rarely earn colleagues’ trust. To secure leadership buy-in, teams should focus on transparent, flexible analytics techniques that align with how business decisions are actually made.
With a consistent understanding of customer meetings in place, the next step was to determine the optimal customer-to-representative ratio to inform our global sales capacity planning. We knew from previous experience that a static model would not be enough. Executives wanted not only the numbers but also the ability to understand how assumptions were influencing the results and how they shaped different business scenarios.
We began by identifying the scenarios that were most relevant to executives. In a cost efficiency scenario, we focused on maximizing the ROI per representative. In a growth-first scenario, the goal was to maximize overall revenue coverage. These scenarios defined the model’s structure and boundaries.
We made key drivers — like meeting frequency by customer segment, meeting length, and available rep time, after accounting for internal responsibilities like training — transparent from the start. Instead of keeping these assumptions in the background, we developed an interactive model that allowed executives to adjust inputs in real time.
For instance, executives could evaluate the impact of asking reps to increase customer-facing time by 5% or allocate more time to high-value customers. The model would recalculate the impact in real time, showcasing the downstream effects on staffing, coverage ratios, and projected revenue.
We also prioritized explainability. When results shifted, the model highlighted the most significant drivers, such as changes in customer engagement time or regional meeting norms. This gave executives a clear view into the logic and allowed them to evaluate decisions with confidence and context.
Applying this dynamic model changed the nature of our planning conversations. Debates over model assumptions gave way to discussions about trade-offs, resourcing priorities, and go-to-market execution. It reinforced a key principle: Business analytics must be decision-driven, interpretable, and context-specific to be truly effective.
Decision Layer: Ground Outputs in Real-World Constraints
The way decisions are framed is just as important as the model itself.
This became especially clear during our global sales capacity planning project. After building an interactive model to calculate optimal customer-to-rep ratios, we discovered that some recommended staffing moves were not feasible due to legal and operational constraints. In certain countries, labor laws required representatives to be native speakers, while other countries imposed limitations on role reassignment. These constraints were complex, country-specific, and often subject to change. Including them directly would have significantly reduced the model’s flexibility and clarity.
Instead, we revised how the model presented its outputs. Rather than suggesting that the model alone could inform staffing decisions, we identified which levers were operationally feasible and which were constrained by regulatory limits. We included callouts that clearly marked where labor policy or regulatory limitations applied.
This approach streamlined the model and grounded planning in reality. Discussions shifted from questioning recommendations’ feasibility to optimizing them within known boundaries. Because the constraints were already defined, business leaders no longer asked, “Why can’t we shift more reps into that market?”
The way decisions are framed is just as important as the model itself. Models do not have to capture every edge case, but they must clearly define what’s possible, what’s not, and why. That is what transforms analysis into action.
Narrative Layer: Lead With a Business Story
Even with clean data, sound models, and well-defined decision levers, poor storytelling can dilute impact.
Rather than treating storytelling as a post-analysis presentation or dashboard polish, we embedded it into the structure and delivery of the analysis itself. In the sales capacity planning project, we built the first three analytics layers by starting with a clear problem statement, highlighting decision principles, identifying constraints, and introducing realistic, data-supported scenarios.
Then, instead of walking through technical logic from the bottom up, we led with the business context and the decisions at stake, such as how a 10% increase in sales team efficiency could affect coverage and staffing. We also used visualizations to surface trade-offs and structured our content to build executive confidence, from high-level implications down to supporting inputs.
Storytelling was not an afterthought; it was a decision enabler. By framing the analysis through a clear, compelling narrative, we helped executives not just understand the outputs but also act on them with clarity and confidence.
At Google SMB, this framework has been applied extensively, particularly in projects involving global sales coverage, resource planning, and go-to-market strategy. The framework’s principles have also been adopted by multiple cross-functional teams, including parts of Google’s finance and marketing organizations.
Our analytics framework achieves that through:
- Clean, consistent data that creates a shared understanding.
- Flexible, transparent models that facilitate strategic exploration.
- Decision framing that clarifies what is and isn’t actionable.
- Narrative delivery that mobilizes leaders from insight to action.
By treating storytelling as a core design feature, we shifted analytics from output generation to strategic enablement. The result was not only better models but also faster alignment, clearer decisions, and more confident action.
The takeaway: When an organization’s analytics are built with decision-making in mind, analytics earns a seat at the table where it truly matters.